Manage your entire operation from one screen
One dashboard that tells you exactly what's healthy and what needs attention across every location, every category, and every team. Stop guessing, start managing.
The challenge
You can't manage what you can't see
Right now, you're making decisions based on fragmented data. One person checks the system, another opens a spreadsheet, a third calls the warehouse. Nobody has a single answer to 'how are we doing?' Problems compound invisibly: low stock in one category, overdue counts in another, a branch slowly drifting until it finally shows up in the revenue. The real cost isn't the individual issue, it's the weeks it takes to notice.
Why it matters
One score that tells you everything
How Beam gives you control
Beam continuously scores your operation across four categories. Each category breaks down into specific metrics, so you never just see a number: you see the reason behind it, and what to do about it.
- Health score across inventory, orders, stocktakes and locations
- Category diagnostics that pinpoint the exact issue
- Real-time activity feed with who, what, when and where
- Multi-branch comparison on one screen
Instead of checking five different systems, opening spreadsheets, or calling the warehouse, you open one screen. A single health score captures inventory levels, order flow, counting discipline and location coverage. When it drops, you know exactly where to look.
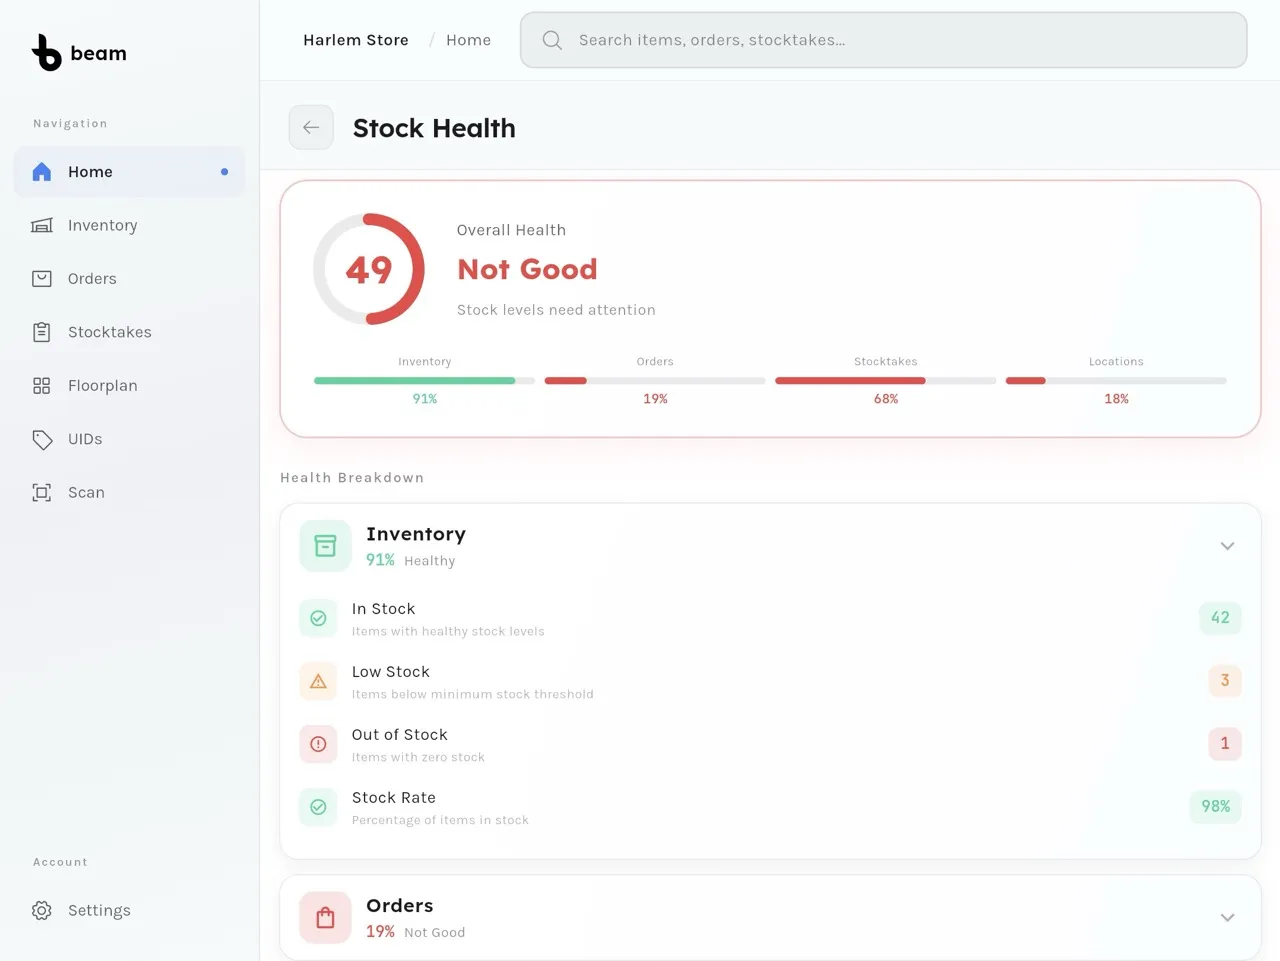
See your operation's health at a glance
One score that combines inventory levels, order flow, counting discipline and location coverage.
- Color-coded health ring: green, blue, or red
- Four category bars show exactly where the score comes from
- Drill into any category for specific metric diagnostics
- Scores update in real time as your team works
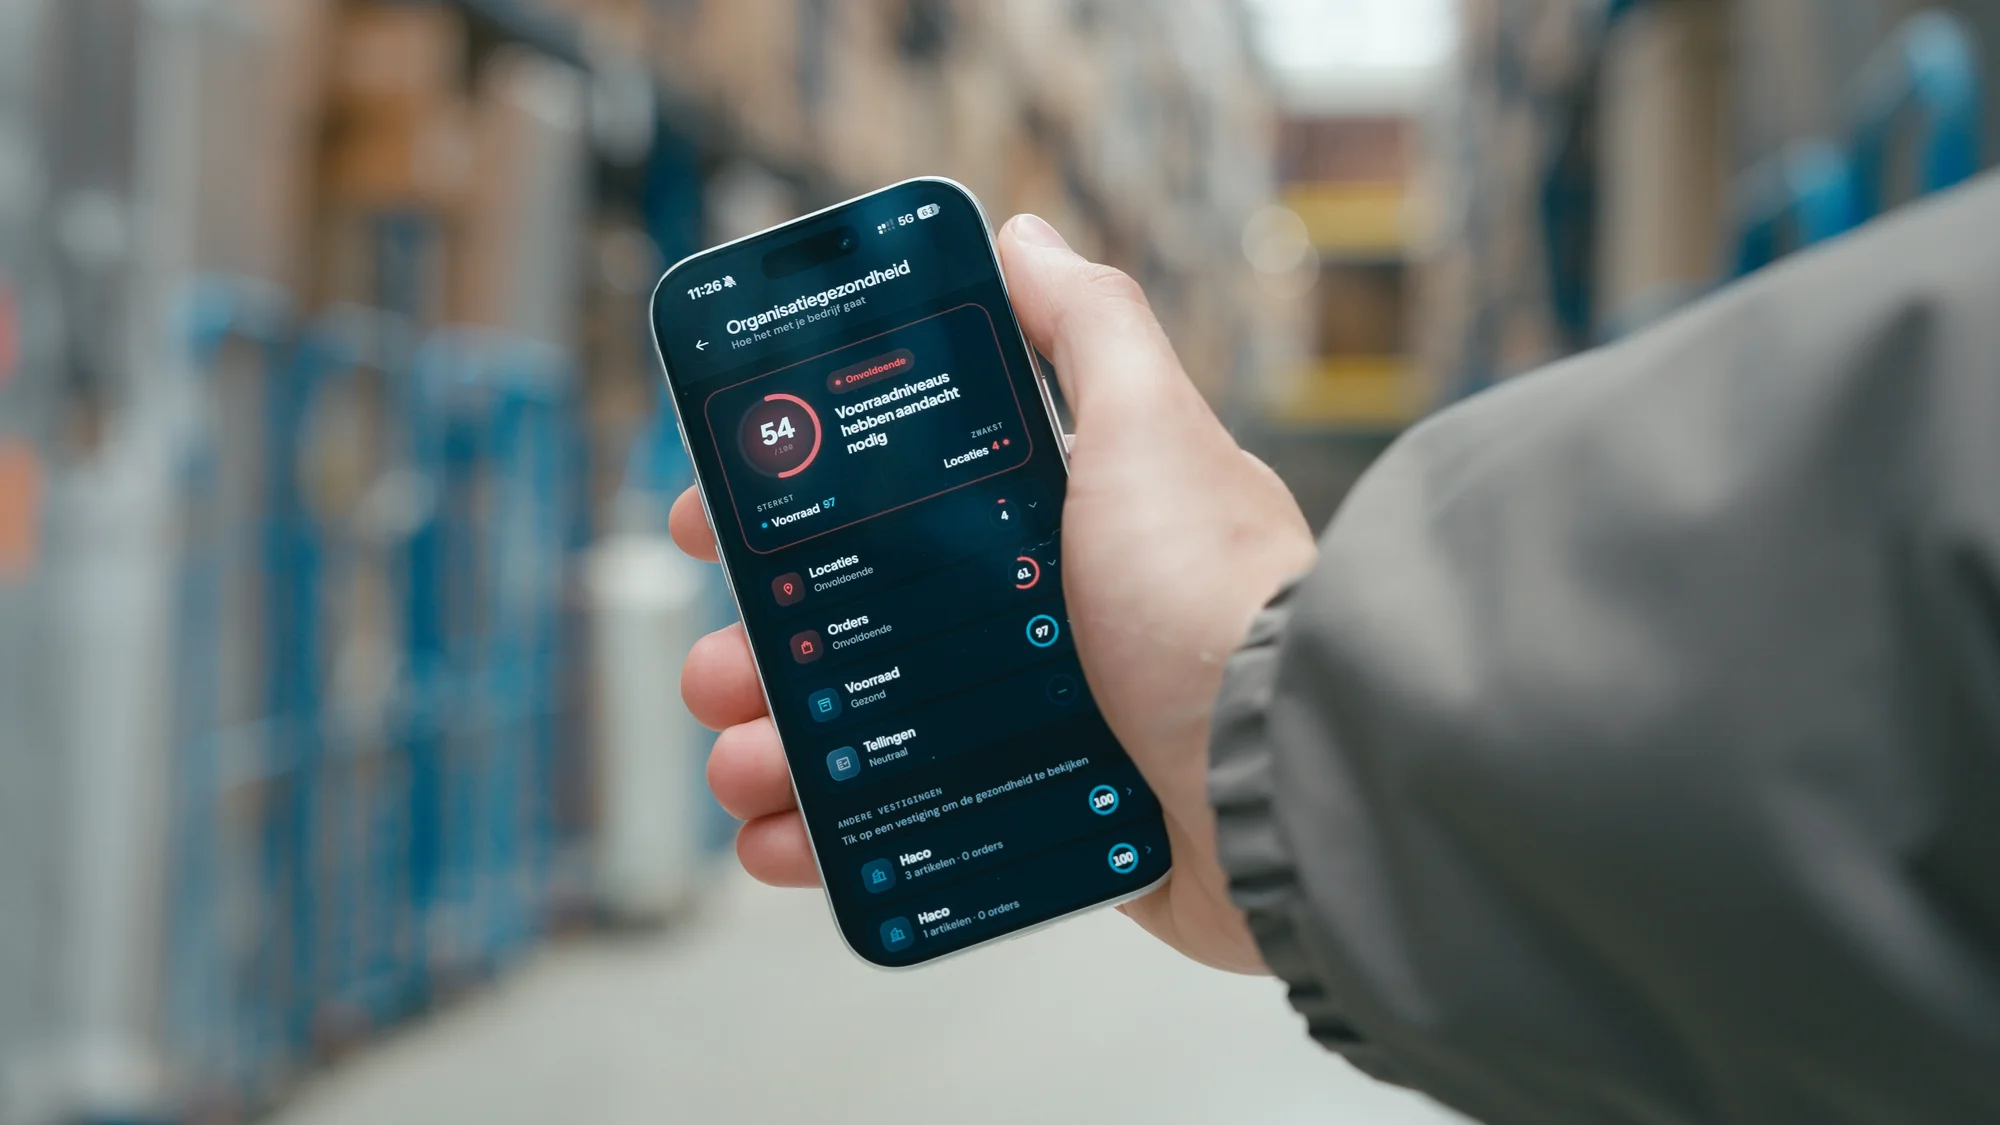
Every action, tracked in real time
A live feed of everything happening across your organization.
- Orders completed, items scanned, locations changed
- Filter by event type: orders, stocktakes, or items
- See who did it, when, and what happened
- Tap any entry to jump to the full detail
How it works
How the dashboard gives you control
Beam continuously measures your inventory operation across four dimensions and surfaces exactly what needs your attention so you always know where to act.
Your operation is scored automatically
Beam evaluates inventory levels, order throughput, counting frequency and location coverage into one health score per branch.
See exactly what's wrong
Drill into any category to find the specific metric that's underperforming. Low stock on fast-movers? Overdue counts? Missing location assignments? You'll know in seconds.
Act and watch it improve
Fix the issue anywhere in Beam and watch your score update in real time. The activity feed confirms every action across your team.
Core Features
The tools to manage your complete operation
Everything you need to stay in control from organization-wide health scoring to individual action tracking.
Health Score
One number that captures your entire operation: inventory levels, order flow, counting discipline and location coverage combined
Multi-Branch Control
Compare every location side by side. See who's healthy, who's slipping, and drill into any branch for the full picture
Activity Feed
Real-time log of every action across your organization. Filter by type, trace back to source, and verify what your team is doing
Category Diagnostics
Four categories with expandable metrics. Find the exact issue dragging performance down, not just that something's wrong, but what
Inventory Analytics
See your stock broken down by category and tracking method. Understand your inventory composition at a glance
Always Up to Date
Scores update as your team works. No end-of-day reports and no manual exports: the dashboard reflects reality right now
Beam gives us insight and control over internal and external logistics and helps manage inventory.
Rebo Systems was looking for a more efficient way to improve order processing and inventory control, but had no need to switch ERP systems.

- Visibility Real-time insight
Complete control over internal and external logistics.
- Speed 10x faster checks
Scan table checks orders in seconds instead of minutes.
- Accuracy <1% error rate
Prevent human errors with automated RFID recognition.
How this fits into the platform
The dashboard is the output of everything else. Every solution feeds it and every action updates it, giving you one source of truth for your entire operation.
Works seamlessly with:
Your health score is only as good as the data flowing in. Every Beam solution feeds it automatically.
Cycle Counting
Counting frequency and accuracy feed your stocktake health. Skip a count and your score drops as it should.
Picking & Scanning
Order completion rates and picking throughput flow into your order health score and the activity feed.
Location Management
How many items have assigned locations drives your location health. The dashboard shows where coverage is lacking.
Scanning devices
Hardware that feeds your dashboard automatically
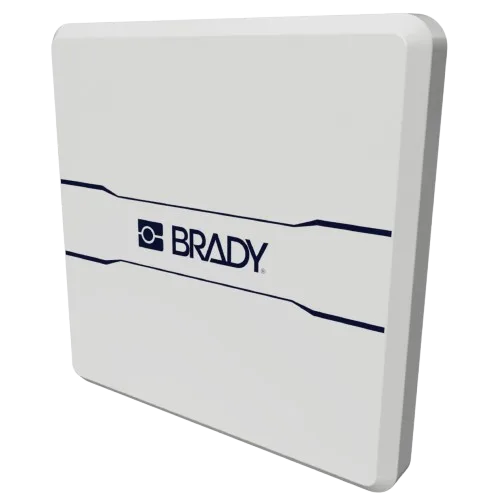
Mount above doorways or zones to automatically identify items as they move between locations. Hands-free traceability across your entire organization.
View product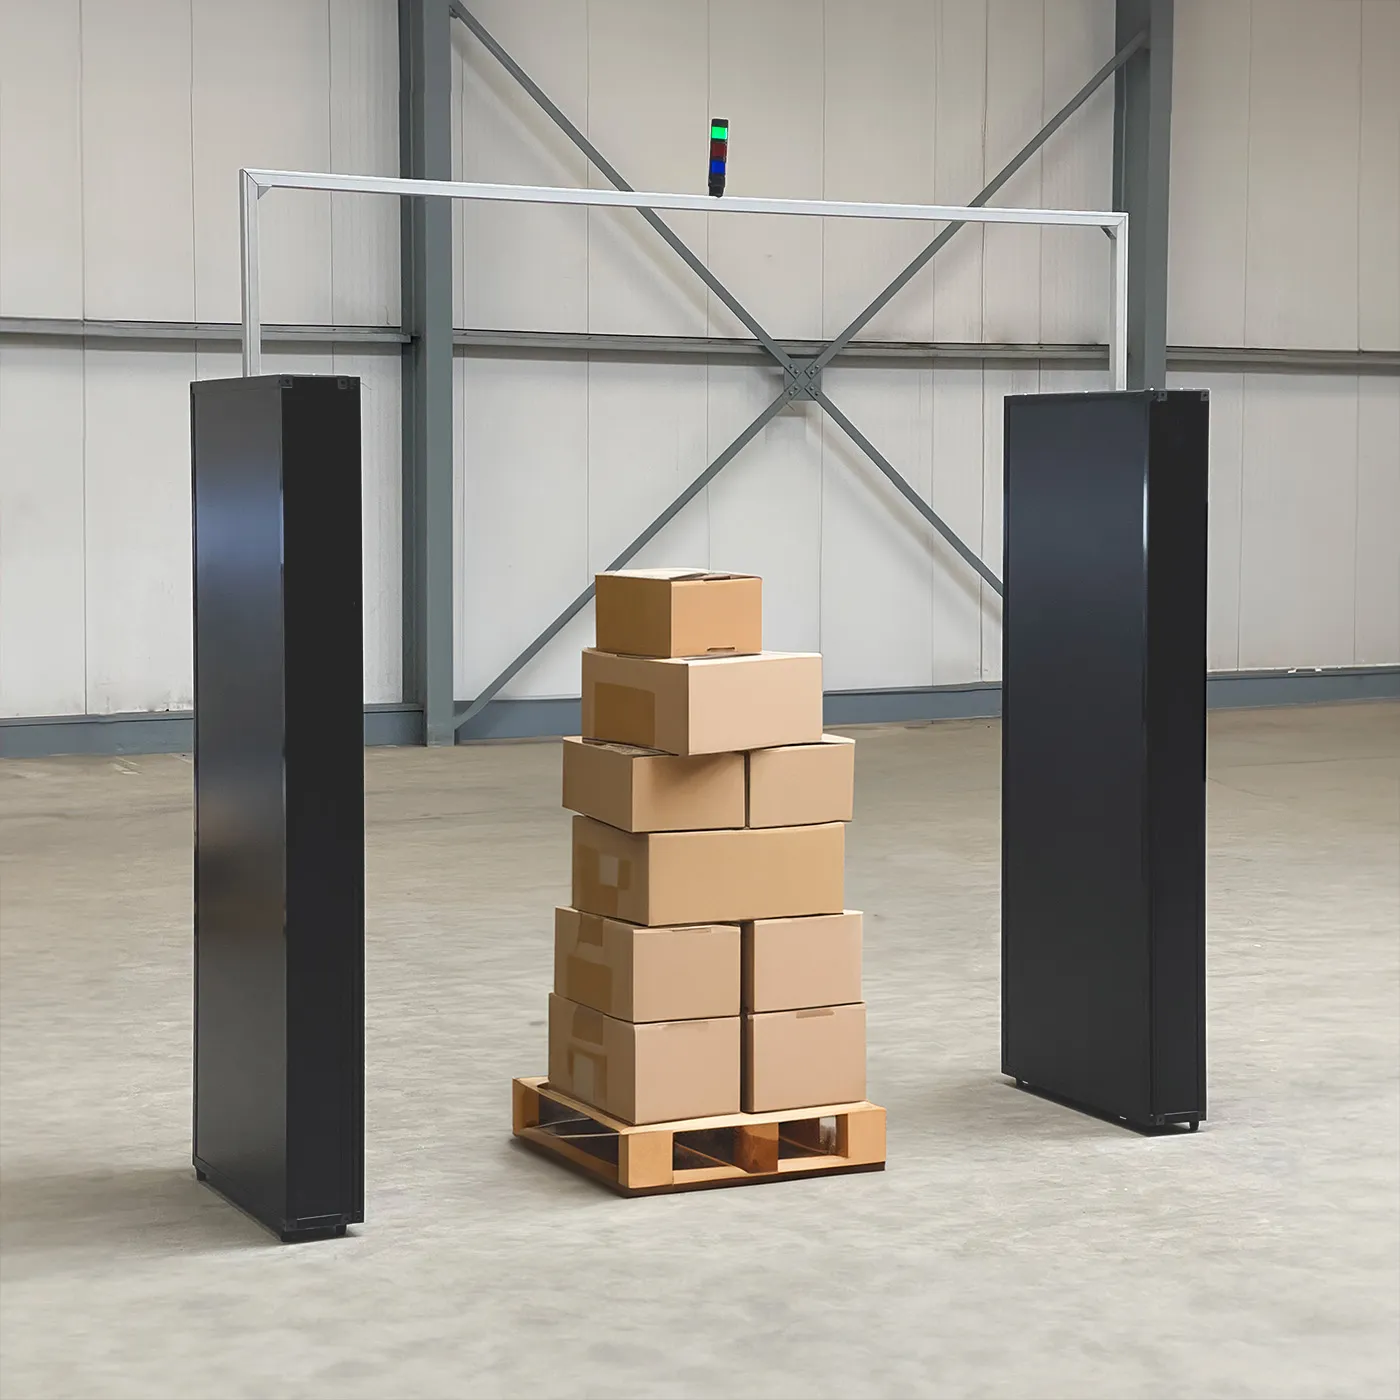
Place at entry and exit points to automatically log every item passing through. Inter-location traceability without manual scanning.
View product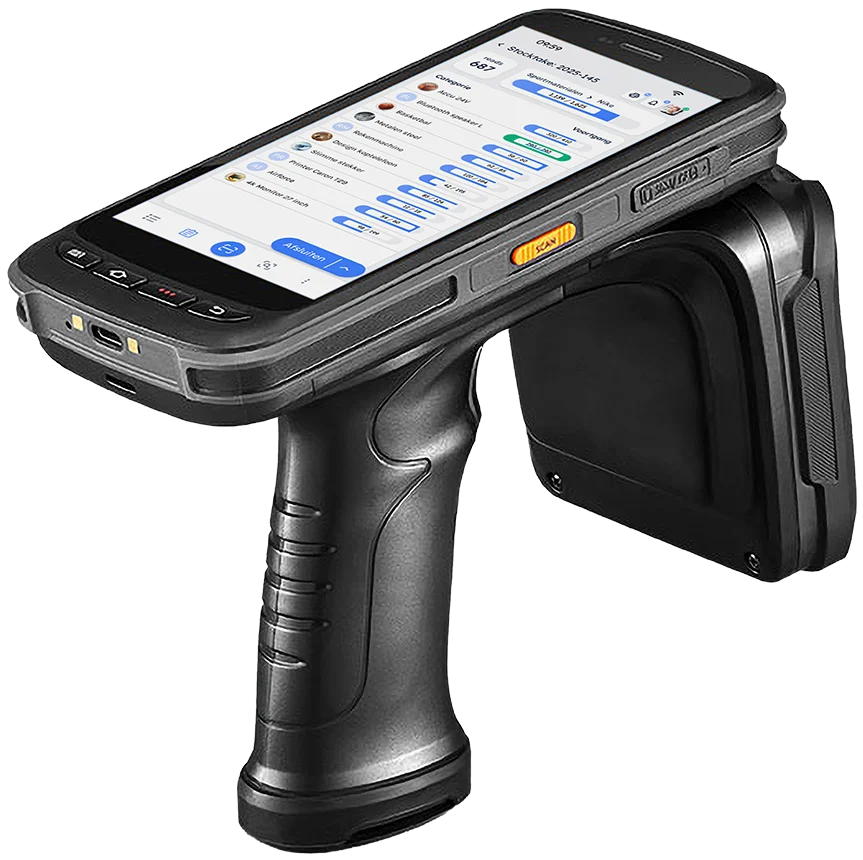
Your daily workforce device. Count stock, verify orders, and scan locations to keep health scores high across every category.
View product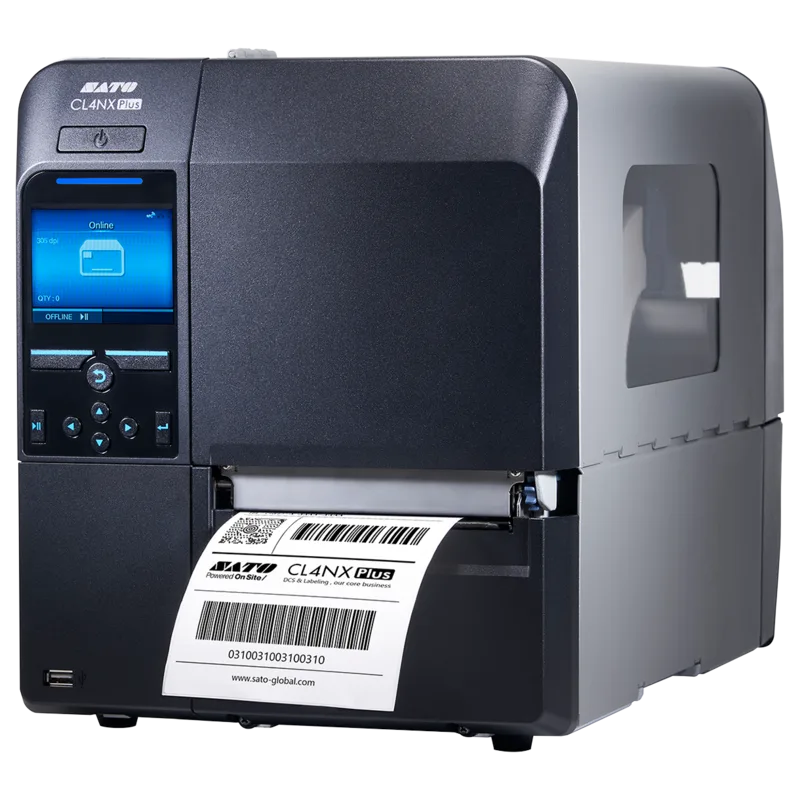
High-volume industrial RFID label printer for steady, reliable tag production. Keep your operation tagged and traceable at scale.
View productThe more solutions you use, the richer your dashboard becomes. Overhead readers and portals feed data automatically, while the C72 handles everything else.
Frequently asked questions
It combines four categories, each worth 25%: inventory health (are stock levels where they should be?), order health (are orders being completed without backlogs?), stocktake health (are you counting regularly and accurately?), and location health (do items have assigned storage spots?). Together they give you one number for your entire operation.
Yes. The branch dashboard shows health scores for every location side by side. You can instantly see which branch is underperforming, tap into it for the full breakdown, and even switch your active organization. One person can oversee the entire network.
By showing you exactly where problems are before they become expensive. Low stock health means you're losing sales or over-ordering. Poor counting discipline leads to write-offs. Missing location assignments waste picker time. The dashboard turns invisible waste into visible, fixable metrics.
Every order change, stocktake event and item modification with who did it, when, and what happened. You can filter by type and tap any entry to jump to the full detail. Think of it as the operational log for your entire organization.
No. The dashboard works with any tracking method. But the more automated your data collection (RFID over barcode over manual), the more real-time and accurate your dashboard becomes.
Yes. As your team works, completing orders, counting stock, assigning locations, the health score and activity feed update automatically. No batch processing, no end-of-day reports. What you see is what's happening right now.